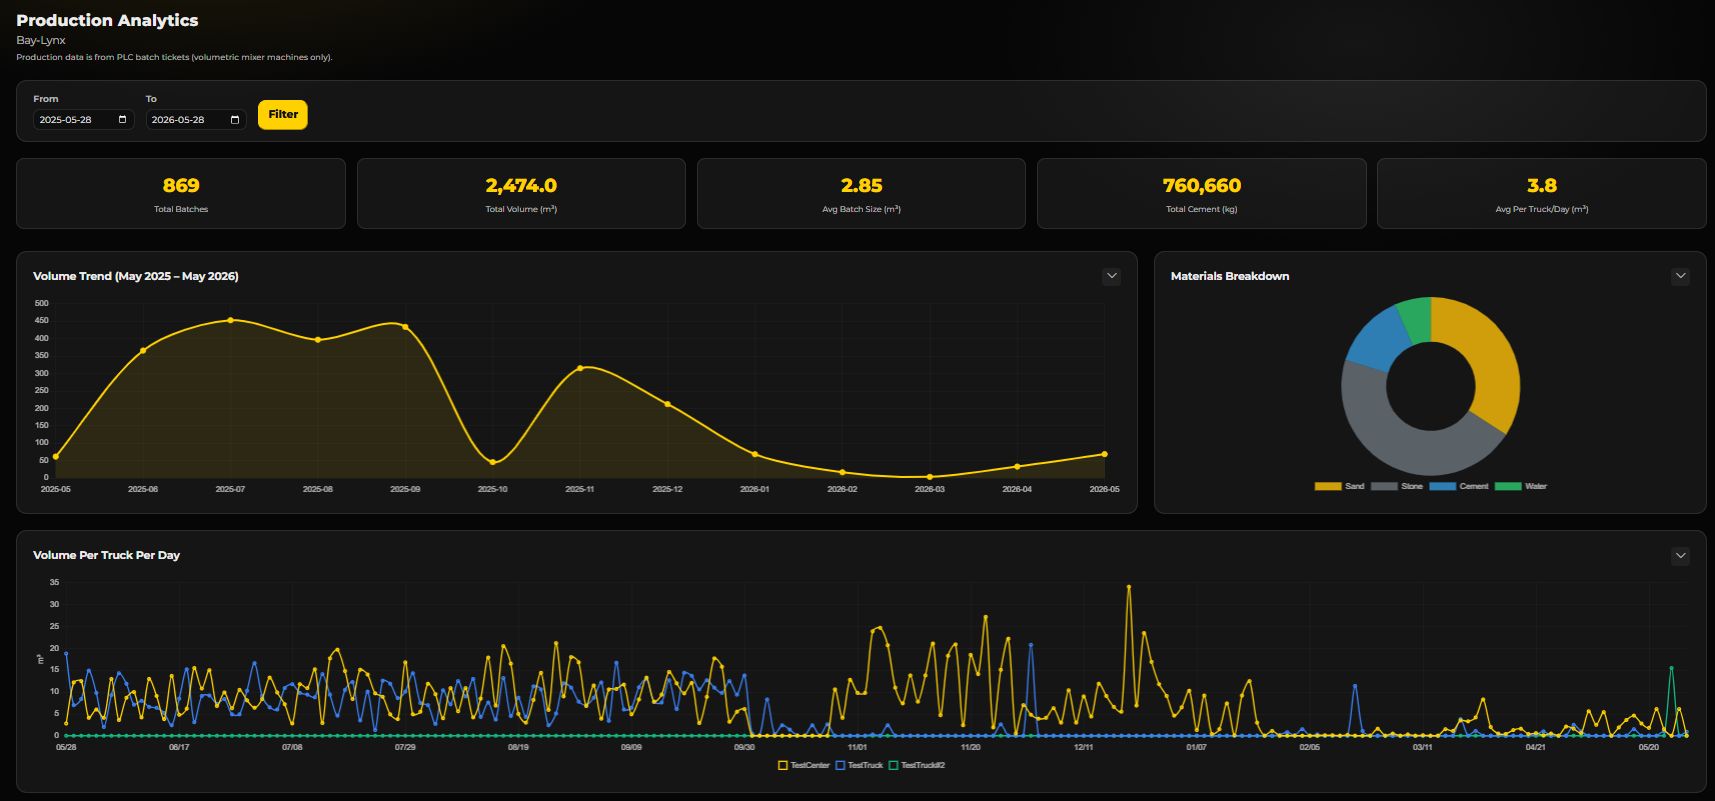
Fourteen purpose-built views over the data your fleet is already producing — production volumes, material trends, dispatch efficiency, fleet and driver performance, costs, safety and forecasting.
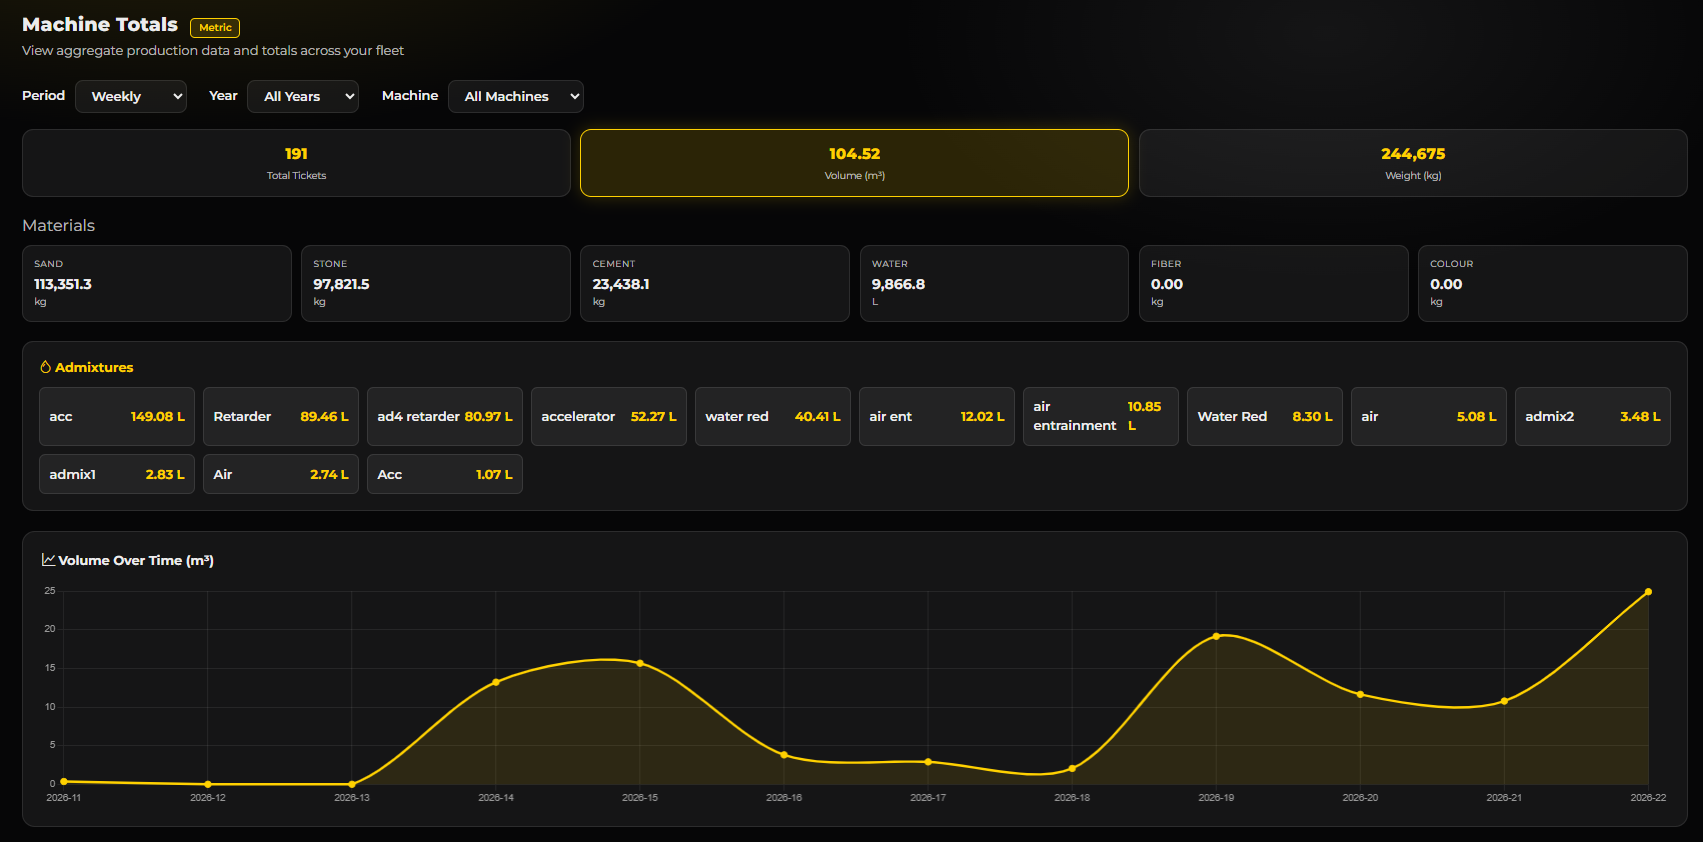
Lifetime and period totals per machine — volume poured, tickets produced and materials consumed. The quick answer to "how much has that truck actually done?"
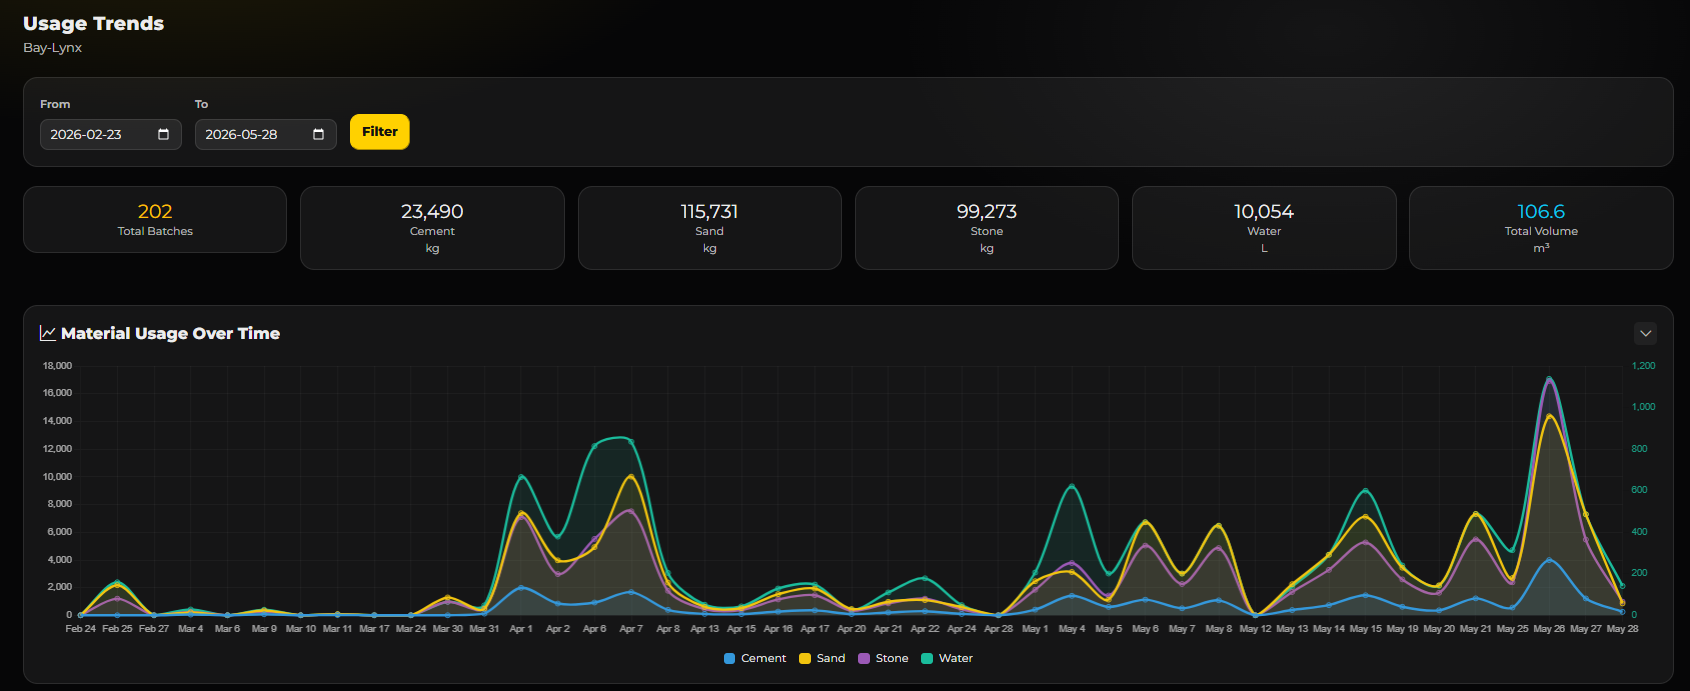
Material consumption over time — cement, sand, stone and water. Spot seasonal patterns, catch a recipe drifting, and see efficiency move across the whole operation.
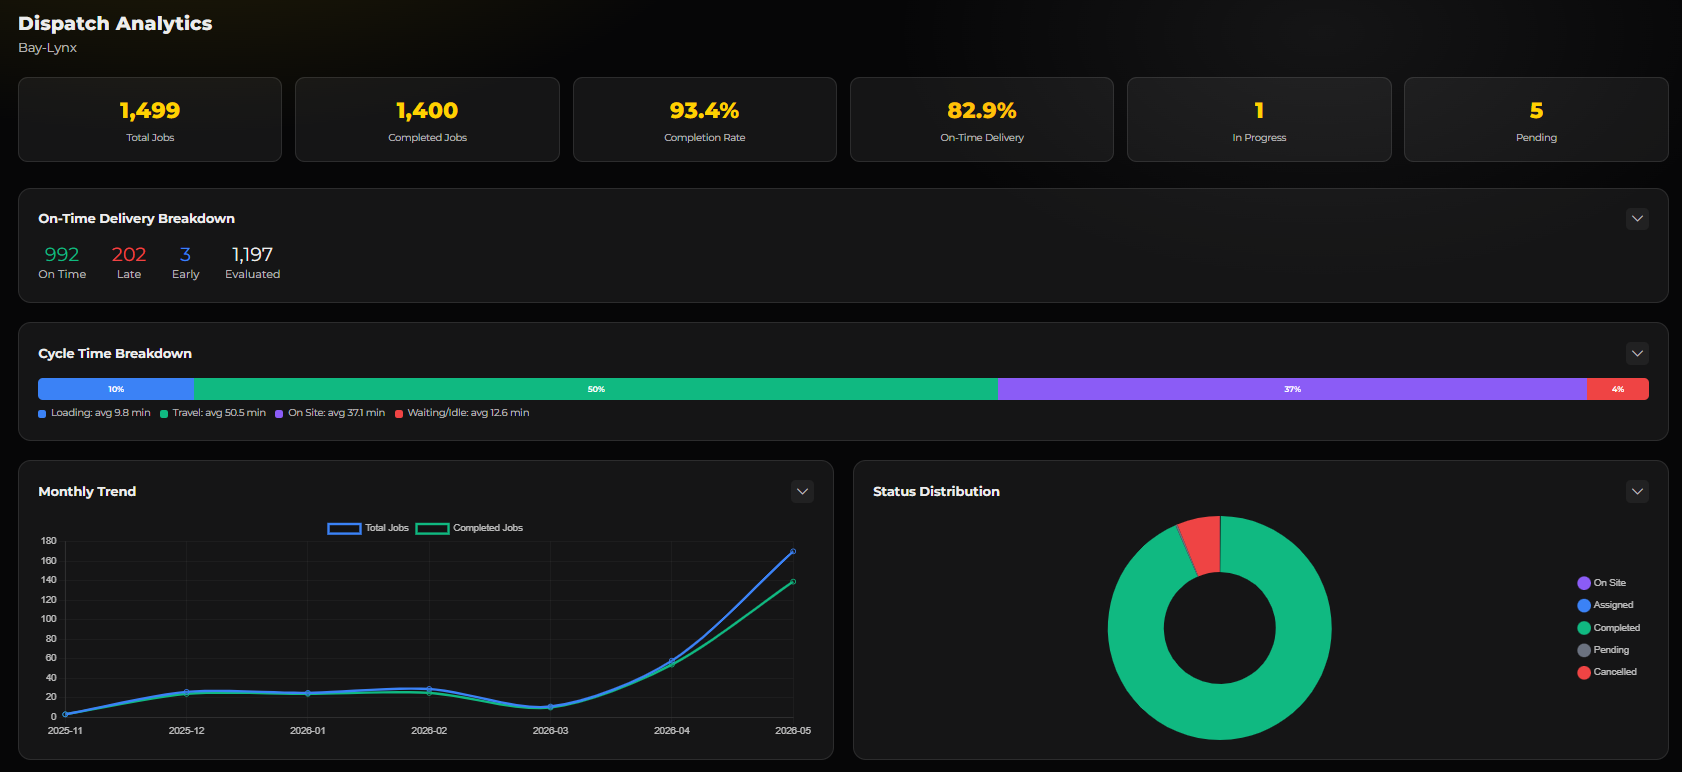
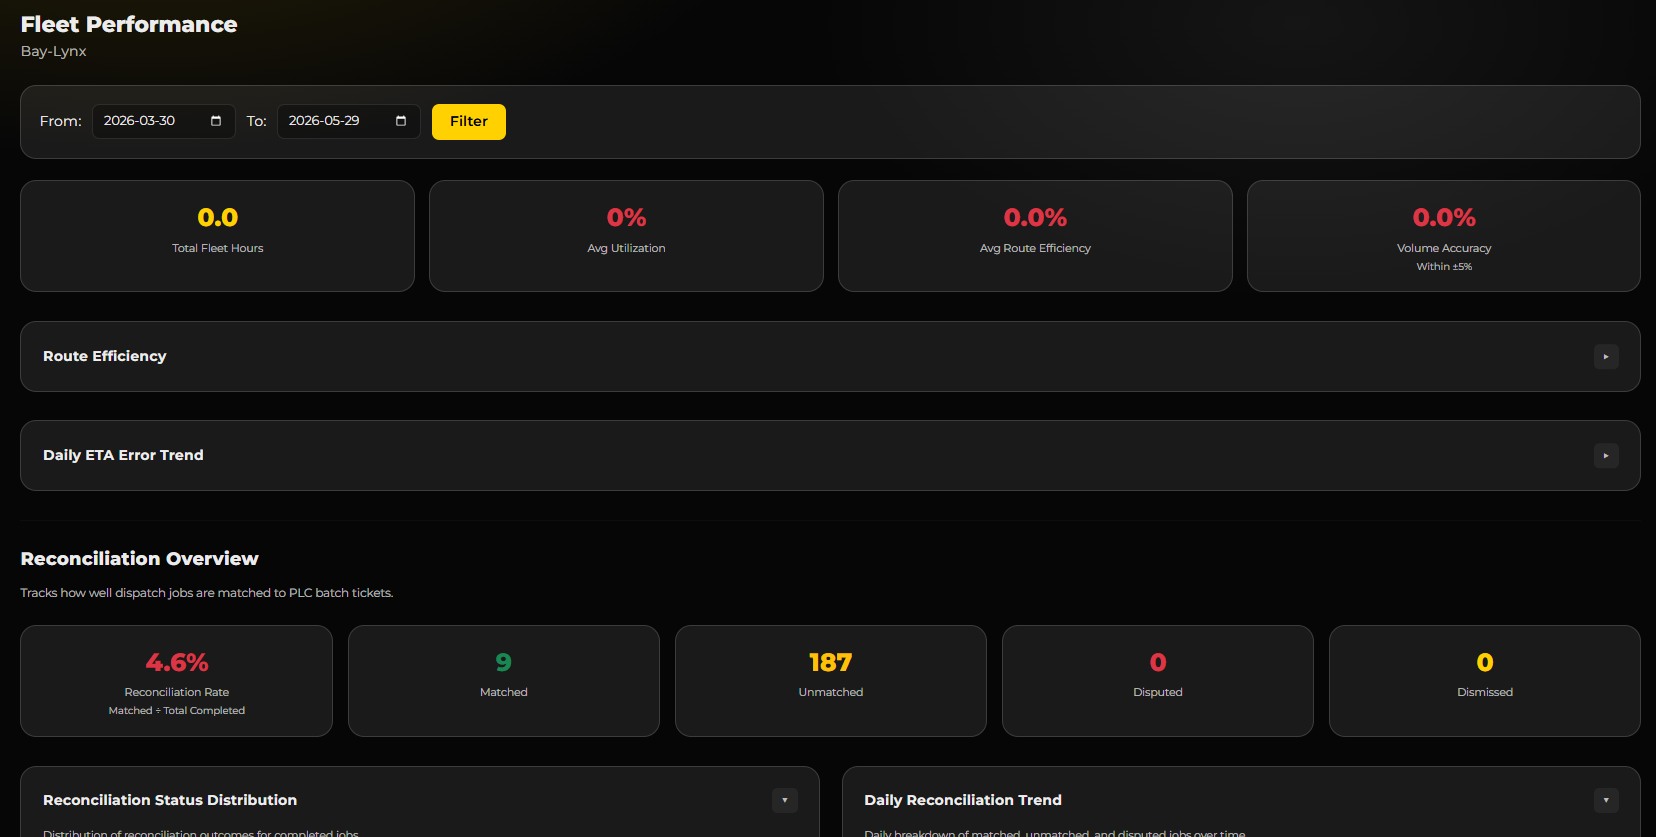
Job completion rates, on-time delivery performance and where the day's hours actually went. Shows which parts of the schedule are costing you.
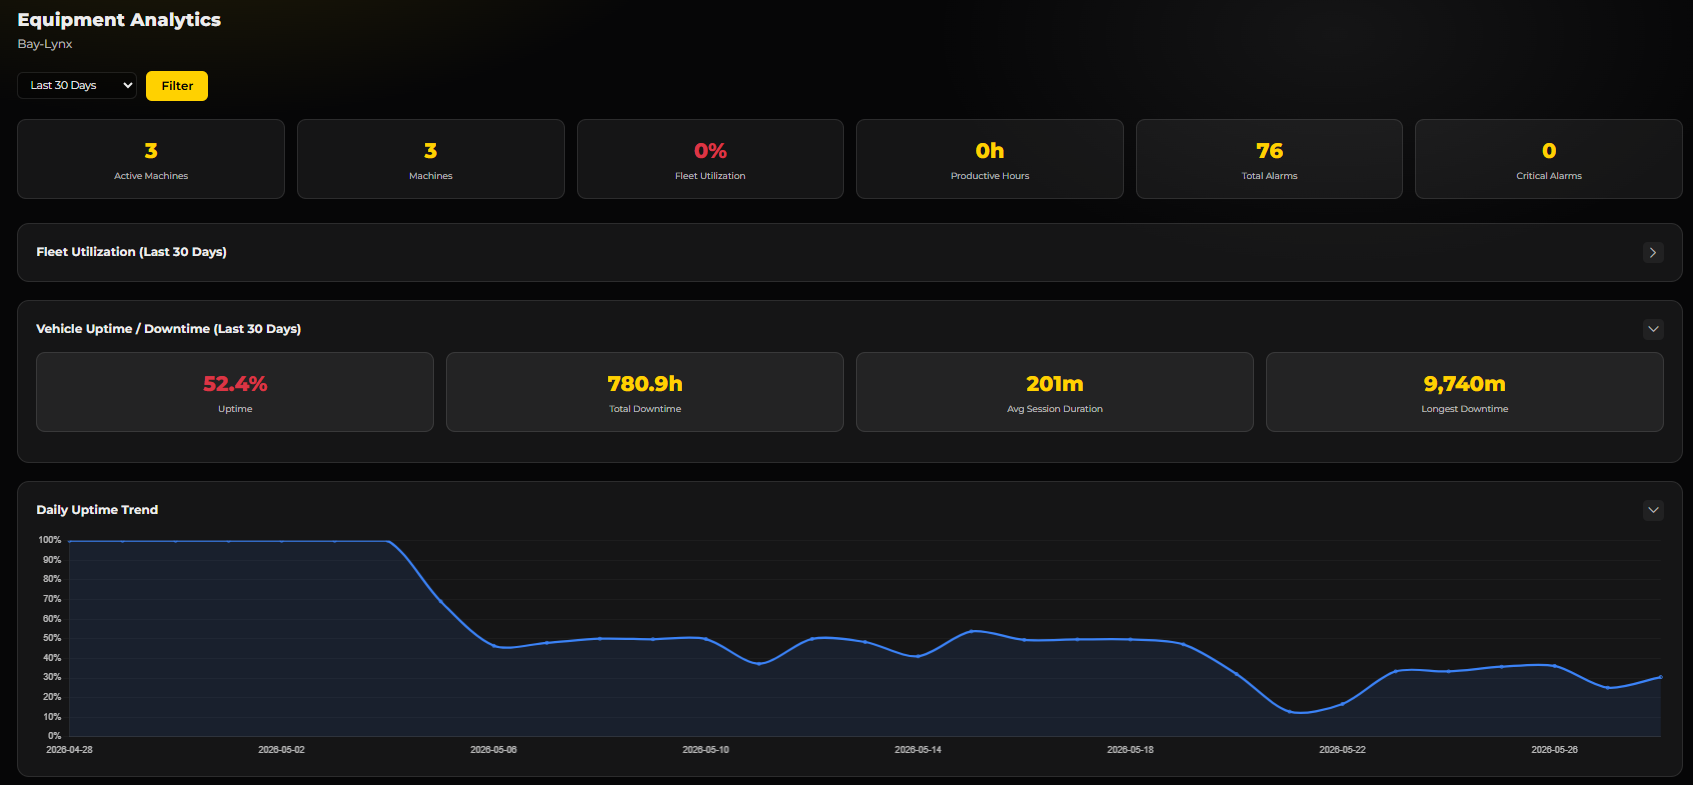
Utilisation and output per machine. Find the truck that is earning its keep and the one that is not, before the next purchase decision.
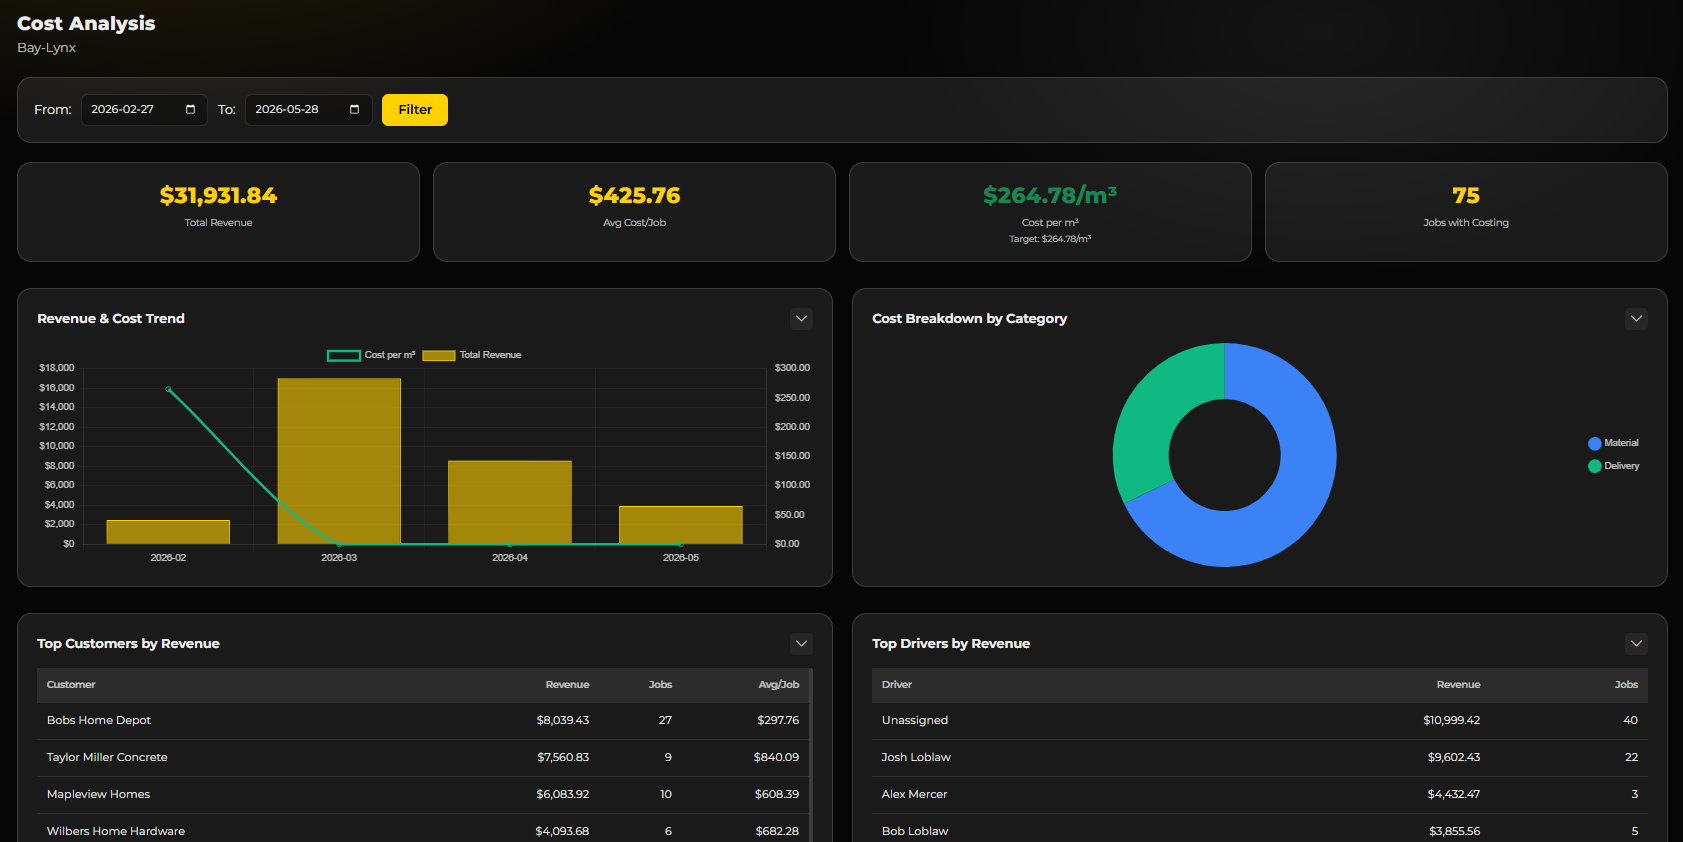
Costs broken down by material, machine, job and customer, with actual against estimated. The view that turns a busy month into a profitable one.
Utilisation rates, idle time and speed analytics across the fleet, with drill-down into any individual machine over any period.
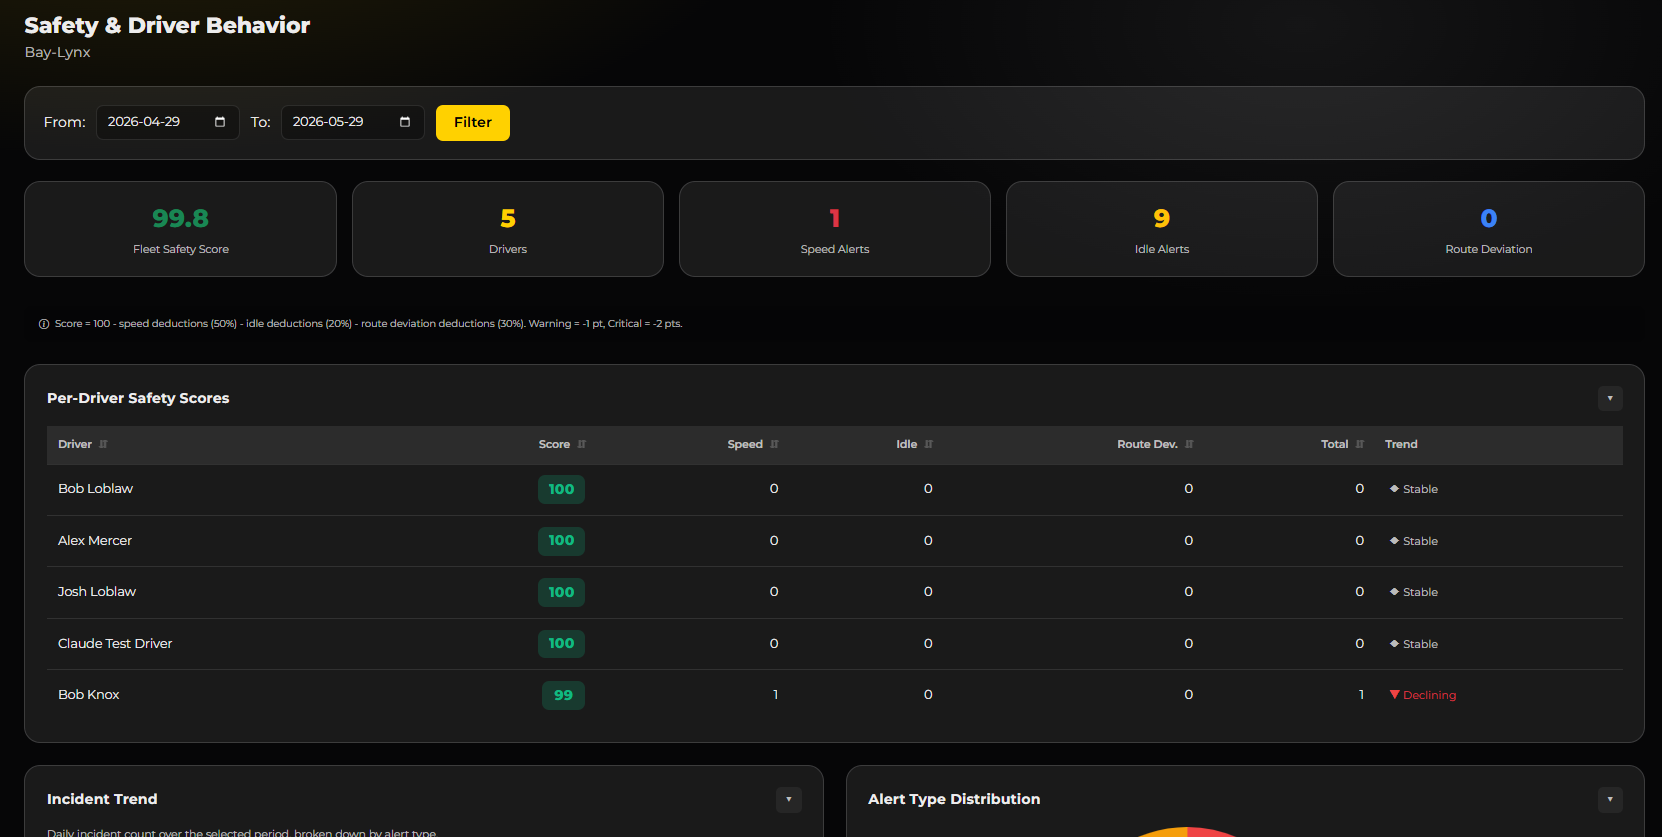
Speed alerts, incident reports and driver behaviour scoring in one place, exportable for your safety file and insurance review.
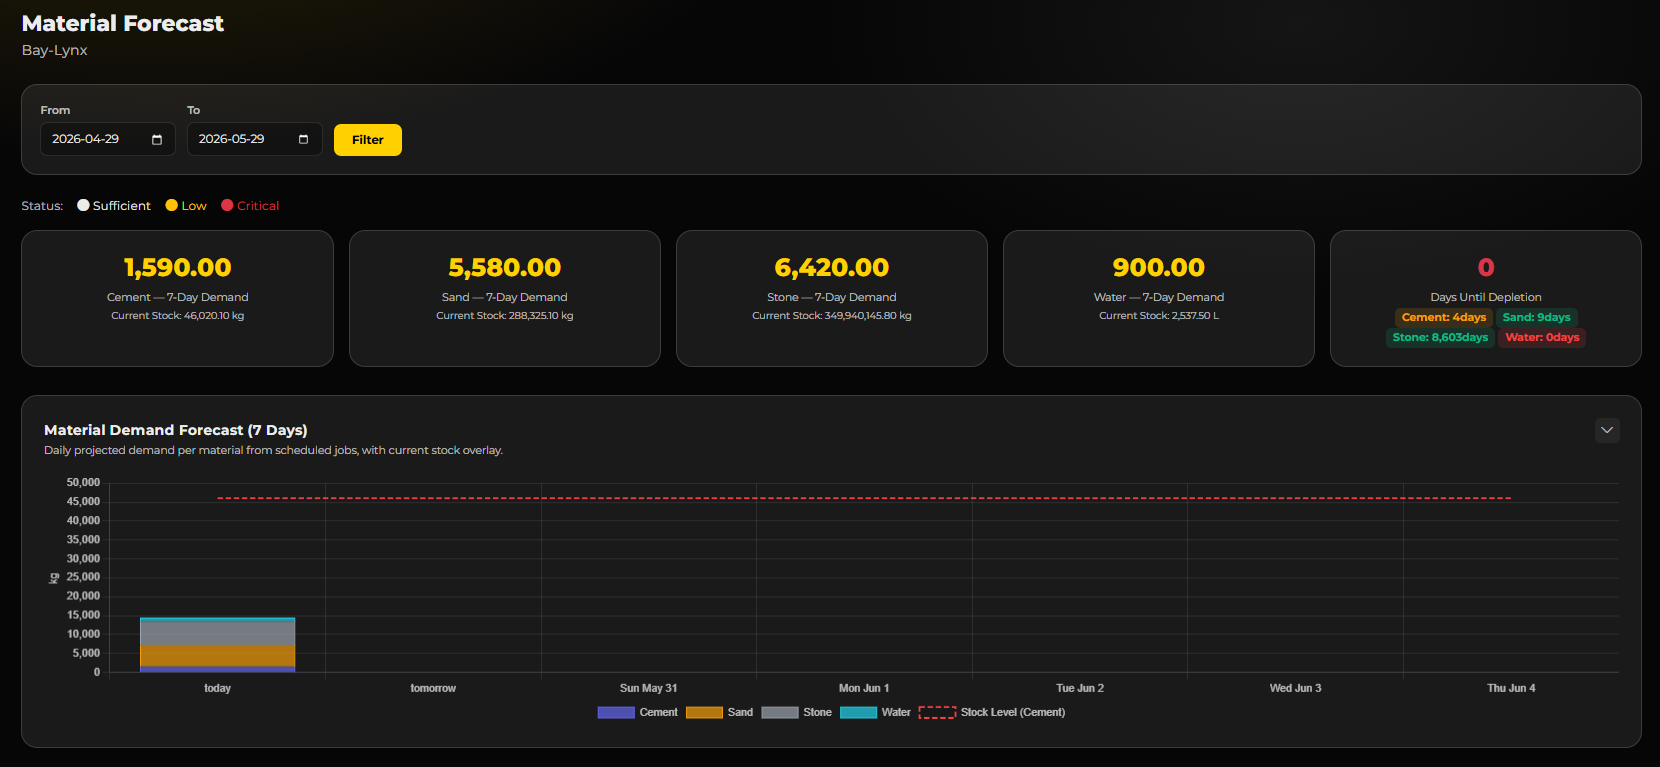
Projected material demand from historical consumption and what is already on the schedule, so you order before you run short.
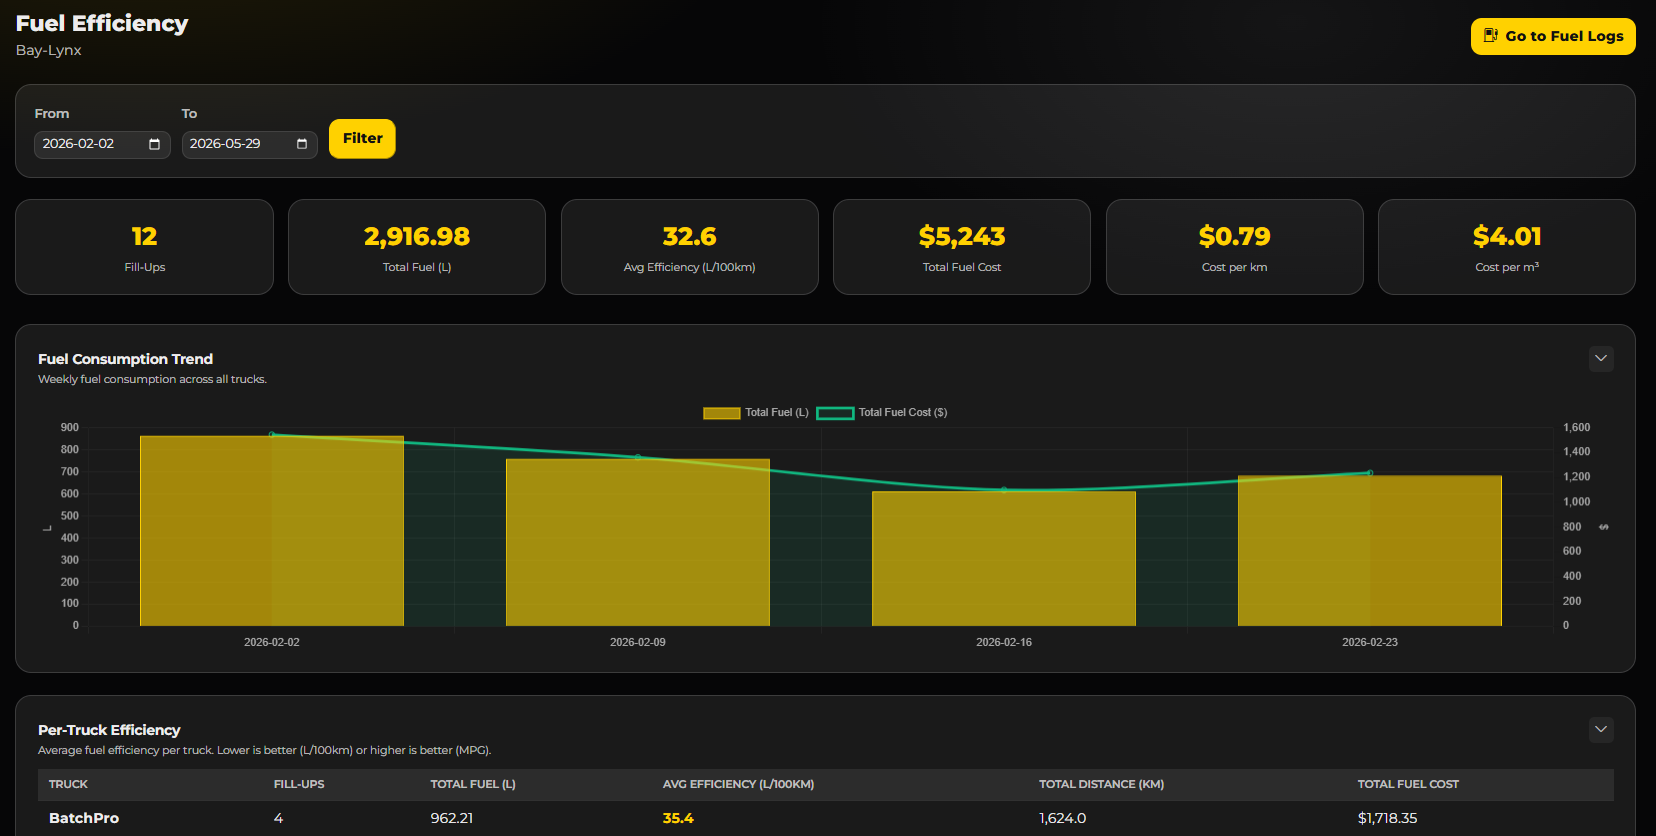
Fuel consumption per machine, per route and per job, from the fuel logs your drivers are already filing.
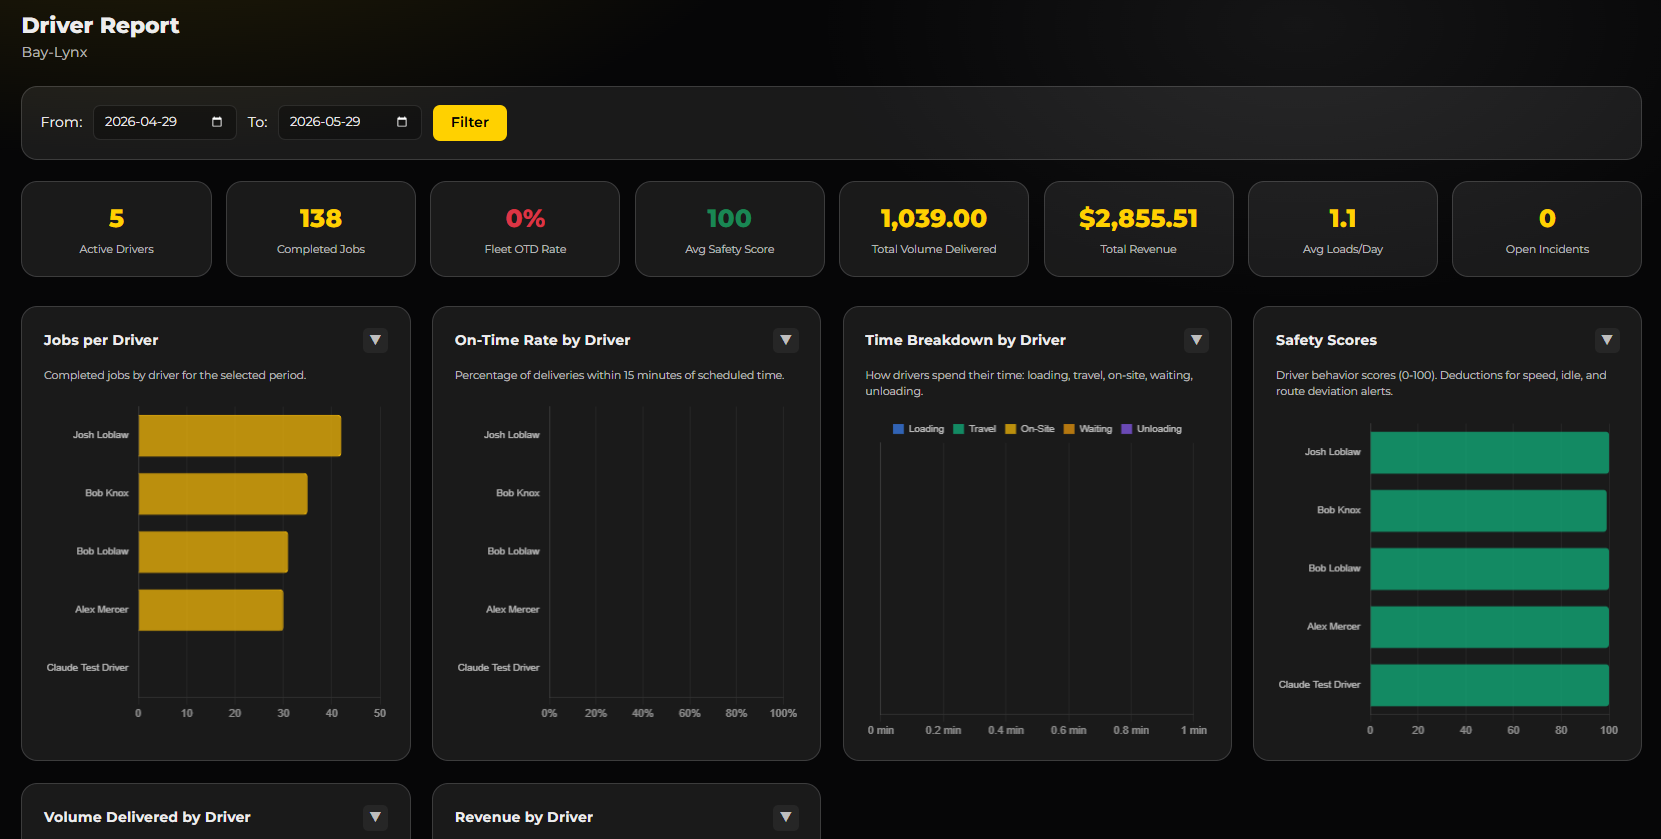
Per-driver performance — deliveries completed, volume poured, distance driven and safety metrics. Use it to recognise the good ones and coach the rest.
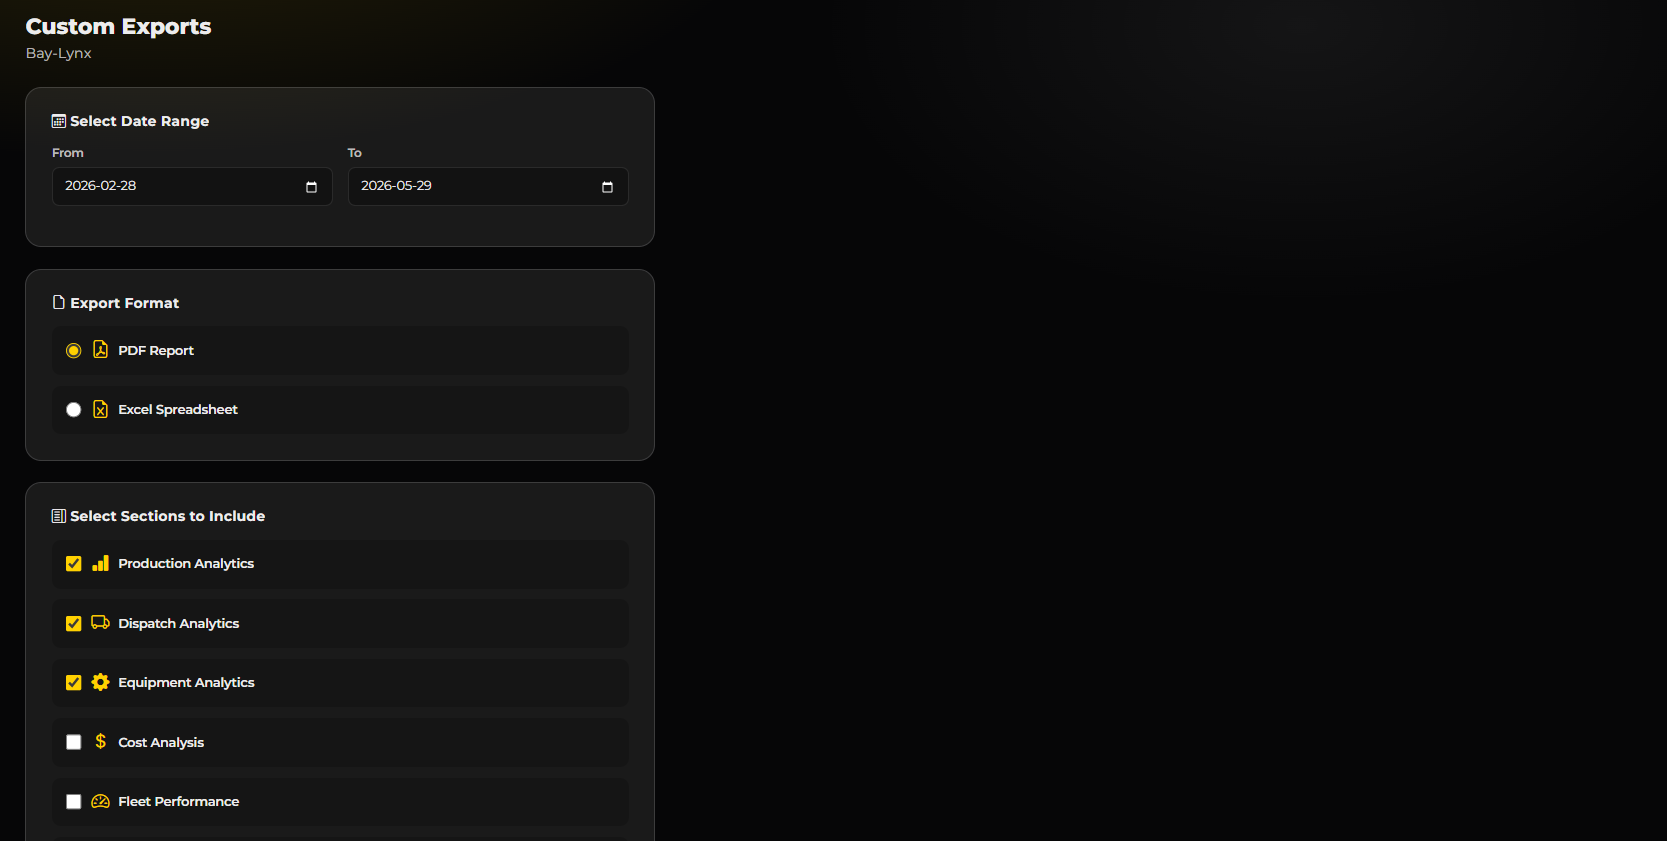
Build an export from any combination of analytics sections. Generate a formatted PDF report or take the raw data into your own tools.
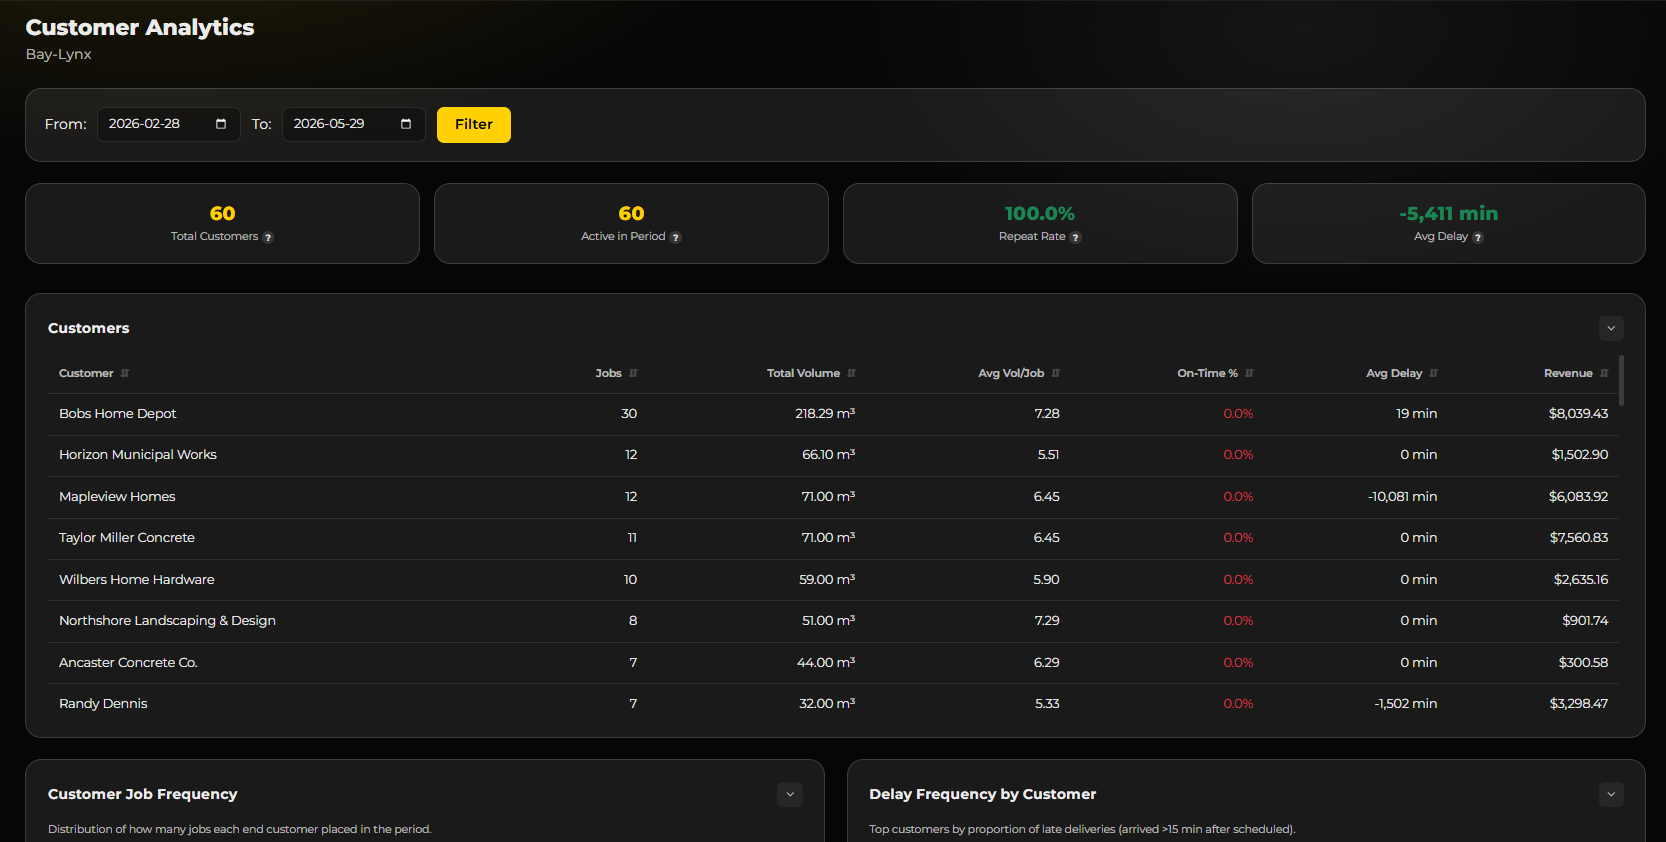
Order frequency, volume trends and revenue concentration per customer — including how much of your month depends on one account.
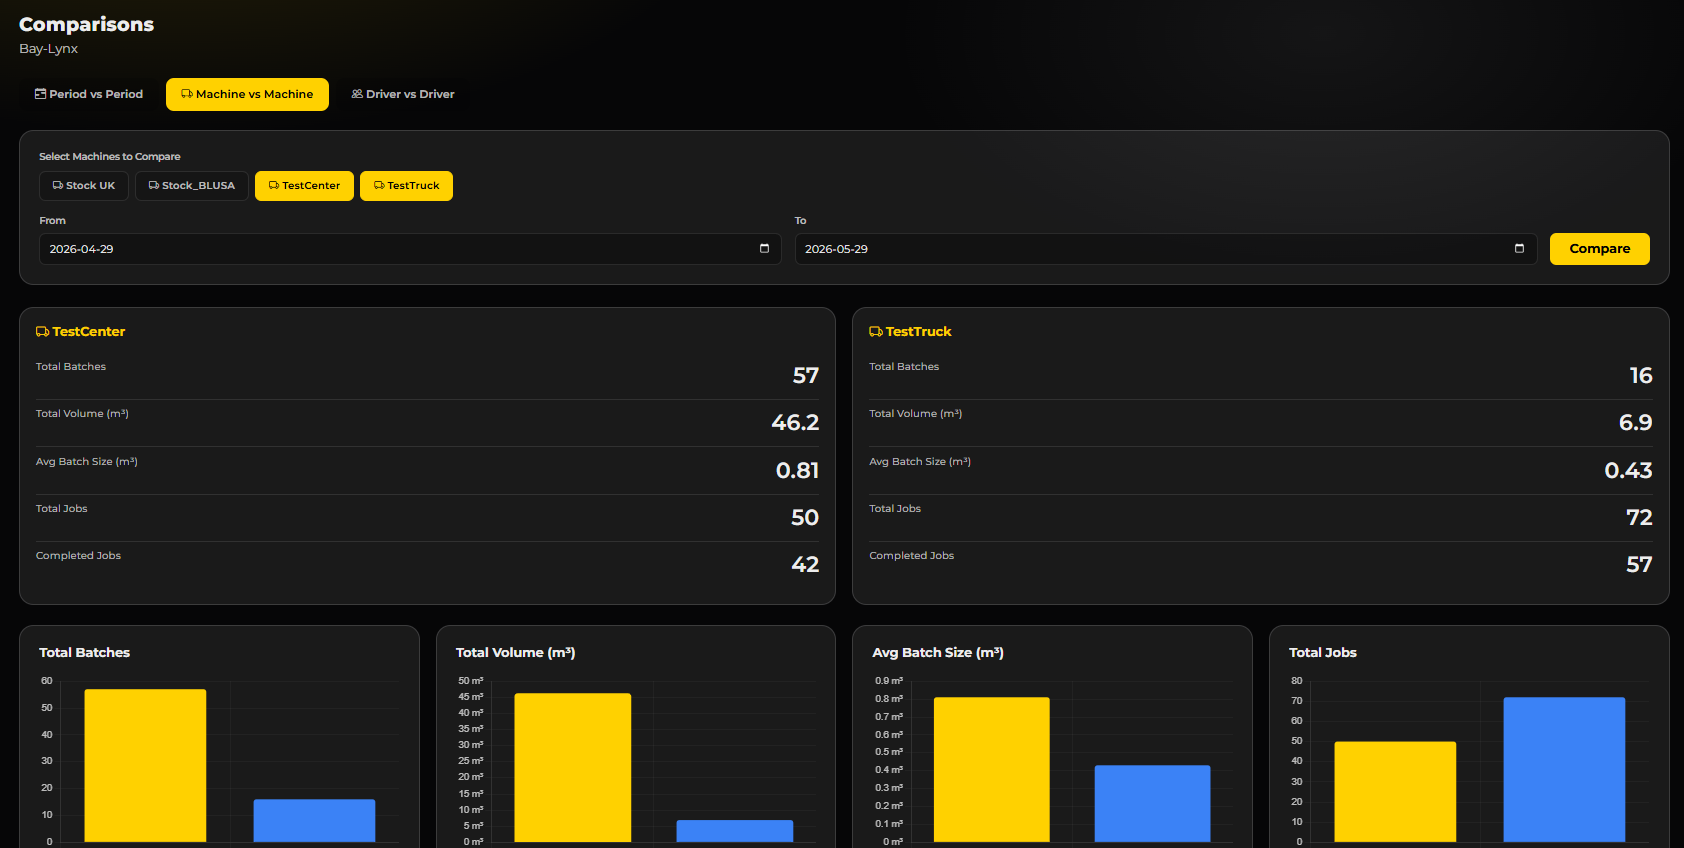
Put two periods, machines, drivers or customers side by side and see exactly what changed.